What Exactly Is the S&P 500?
If you’ve ever heard someone say “the market was up today”, chances are they were talking about the S&P 500. But what is it, really, and why does this one index have so much influence over the global economy, investors, and even your retirement savings?
Let’s break it down.
A Snapshot of America’s Corporate Powerhouses
The S&P 500, short for the Standard & Poor’s 500 Index, is a collection (or “basket”) of the 500 largest publicly traded companies in the United States, representing about 80% of total U.S. stock-market value.
It’s not just tech giants like Apple, Microsoft, and Amazon. You’ll also find companies like Coca-Cola, Johnson & Johnson, Home Depot, and ExxonMobil. Together, these businesses paint a remarkably broad picture of the U.S. economy, spanning technology, healthcare, energy, finance, consumer goods, and more.
The index was launched in 1957 by Standard & Poor’s (now part of S&P Global) to track the performance of leading U.S. companies. Today, it serves as the benchmark for roughly $15 trillion worth of assets worldwide.
Fun fact: The index actually includes
503 components (or stock tickers) because three companies have two share classes listed.
How It’s Built: Market-Cap Weighting
Not all companies in the S&P 500 are treated equally. The index uses a market-capitalization weighting system, meaning bigger companies have a greater impact on its movements.
If Apple, whose market cap is currently around $3.8 trillion, rises by 1%, it moves the index more than if a smaller company like Nordstrom or Ford does. This weighting reflects economic reality: a $3 trillion company influences the market far more than a $30 billion one.
That’s also why the S&P 500 often seems to move in step with the big tech names. Over the past decade, companies like Apple, Microsoft, Amazon, Alphabet (Google), and NVIDIA have grown so large that together they account for nearly one-quarter of the index’s total value.
Why Investors Watch It Closely
The S&P 500 is widely regarded as the best single gauge of the U.S. stock market’s overall health.
When financial commentators or economists say “the market’s up” or “the market’s down,” they’re almost always referring to this index.
It’s also the most common benchmark for performance comparison.
If a mutual fund or ETF manager beats the S&P 500’s return, they’ve “outperformed the market.” If not, they’ve lagged behind.
The Long-Term Power of Compounding
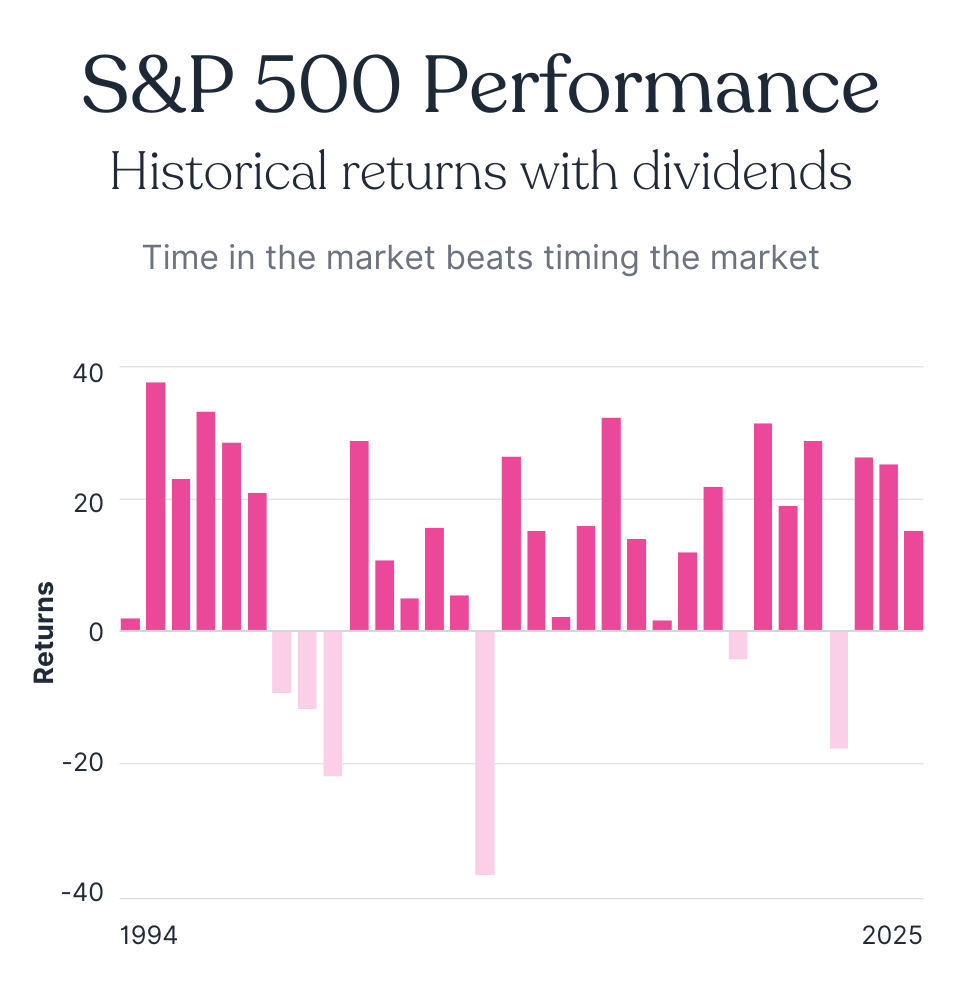
Historically, the S&P 500 has returned about 10% annually on average since inception (roughly 7% after inflation). That doesn’t mean it goes up 10% every year, far from it.
Some years see major losses, others huge gains. But over decades, that average compounds dramatically.
For example, $10,000 invested in the S&P 500 in 1980 (dividends reinvested) would be worth over $1 million today. That’s the power of broad diversification and long-term compounding.
Why Index Funds Changed Everything
Before index investing, you had to pick individual stocks, or pay high fees to a manager who did. In 1976, Vanguard’s founder Jack Bogle introduced the first S&P 500 index fund, allowing anyone to own a slice of all 500 companies at once.
That innovation democratized investing. Today, trillions of dollars sit in low-cost index funds and ETFs tracking the S&P 500, making it one of the simplest ways for investors to build wealth over time.
Critiques and Limitations
Even though the S&P 500 is a powerful benchmark, it’s not perfect.
- Concentration risk: The index has become top-heavy, with a handful of mega-cap tech firms dominating performance.
- U.S.-only exposure: It doesn’t include international markets, so investors relying solely on it miss out on global diversification.
- Market-cap bias: Companies that have already grown large get a bigger weighting, meaning investors automatically buy more of what’s already expensive.
Still, despite these flaws, it remains the gold standard for understanding and tracking stock-market performance.
So, Why Does It Matter to You?
Whether you’re a seasoned investor or just starting out, the S&P 500 tells you more than you might think:
- How confident investors are in the U.S. economy
- How your retirement savings or portfolio might be performing
- And how wealth grows, or contracts, over time
It’s not just a number on a financial ticker. It’s a reflection of how America’s biggest companies, and by extension, the economy, are doing.
Start Where Most People Wish They Could
The S&P 500 represents the long-term growth engine of the U.S. economy, one that has consistently rewarded patient investors. But patience doesn’t mean waiting decades to see meaningful compounding take effect.
That’s where
Raise Investment comes in.
Instead of slowly dripping money into the market month by month, Raise gives you the growth power of a large upfront investment while keeping your contributions budget-friendly through a monthly membership model.
In other words: you get to participate in the long-term performance of the S&P 500, starting on third base.
Note: The information in this blog is for educational purposes only. It does not constitute financial advice.